Python에서 데이터를 시각화할 때 Pandas와 Matplotlib는 매우 유용한 도구입니다.
이들 도구를 활용해 데이터 시각화를 위한 GUI 애플리케이션을 만들 때, Tkinter와 함께 사용하면 인터랙티브한 환경을 쉽게 구축할 수 있습니다.
하지만 Mac 환경에서는 몇 가지 호환성 문제가 발생할 수 있는데, 이를 해결하는 방법과 함께 데이터를 기반으로 플롯을 그리고, 이를 Tkinter GUI에 표시하는 방법을 소개하겠습니다.
주요 기능
Pandas 데이터프레임을 사용하여 데이터를 로드 및 관리
Matplotlib를 사용하여 플롯을 생성하고, GUI에 표시
Combobox 위젯을 사용해 사용자가 선택한 플롯 유형에 따라 그래프를 변경
MacOS 호환성을 고려한 백엔드 설정과 플롯 클리어링
코드 구현
아래는 이를 구현한 Python 코드입니다. 각 부분을 단계별로 설명하겠습니다.
import tkinter as tk
from tkinter import ttk
import pandas as pd
import matplotlib.pyplot as plt
from matplotlib.backends.backend_tkagg import FigureCanvasTkAgg
# Matplotlib 백엔드를 TkAgg로 설정 (MacOS 호환성 개선)
plt.switch_backend('TkAgg')
# 예제용 데이터프레임 생성
data = {
'A': [1, 2, 3, 4, 5],
'B': [5, 4, 3, 2, 1],
'C': [2, 3, 4, 3, 2]
}
df = pd.DataFrame(data)
# Tkinter 기본 창 설정
root = tk.Tk()
root.title("DataFrame Plot Viewer")
root.geometry("600x400")
# 플롯을 그릴 캔버스 프레임 생성
frame = tk.Frame(root)
frame.pack(fill=tk.BOTH, expand=True)
# Combobox 생성 및 설정
plot_type = tk.StringVar()
combobox = ttk.Combobox(root, textvariable=plot_type)
combobox['values'] = ("Line Plot", "Bar Plot", "Scatter Plot", "Box Plot")
combobox.set("Line Plot")
combobox.pack(pady=10)
def draw_plot():
# 선택된 플롯 타입에 따라 플롯 그리기
fig, ax = plt.subplots()
plot_selection = plot_type.get()
# 기존 플롯 클리어
ax.clear()
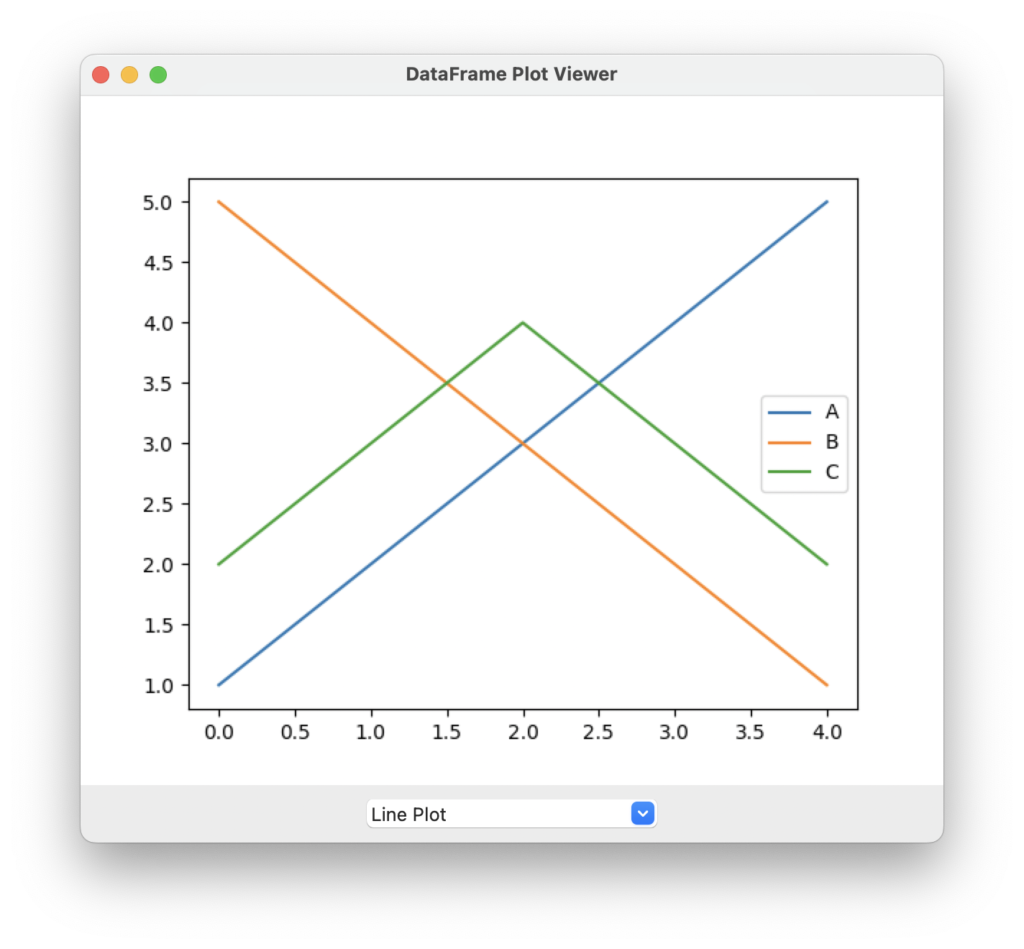
if plot_selection == "Line Plot":
df.plot(ax=ax)
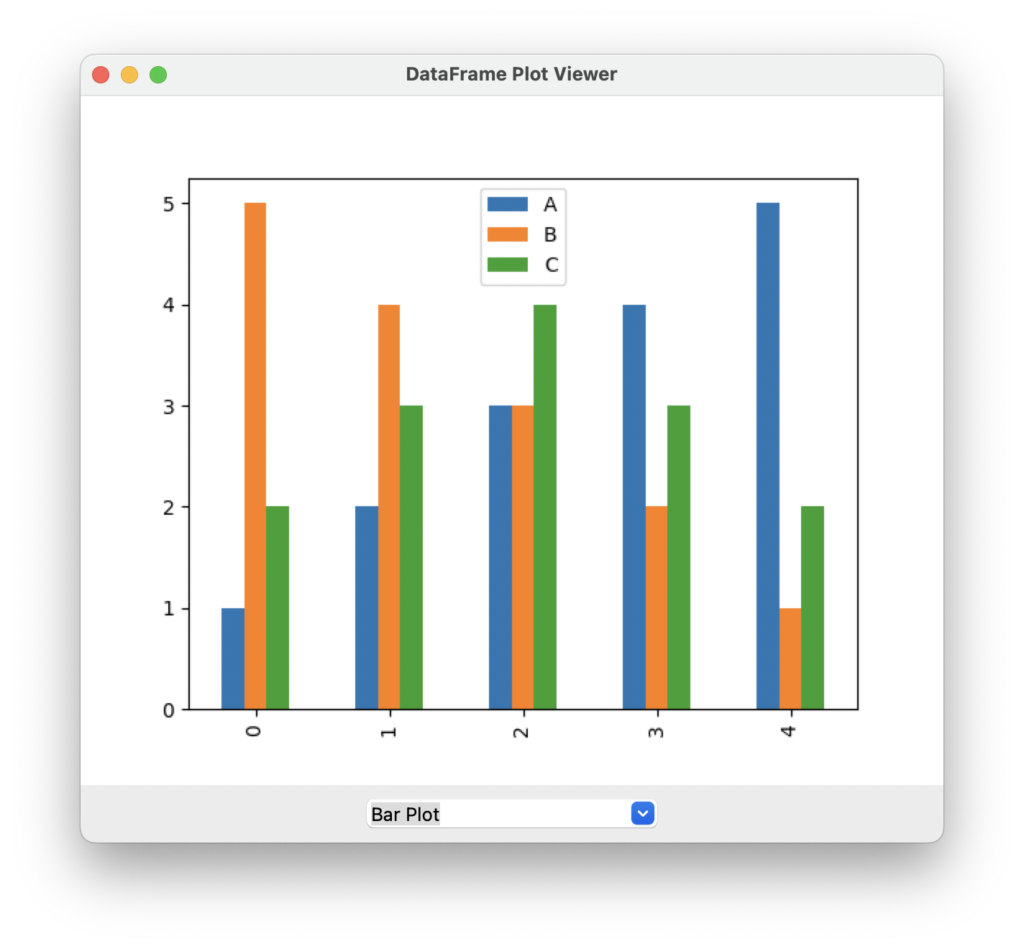
elif plot_selection == "Bar Plot":
df.plot(kind='bar', ax=ax)
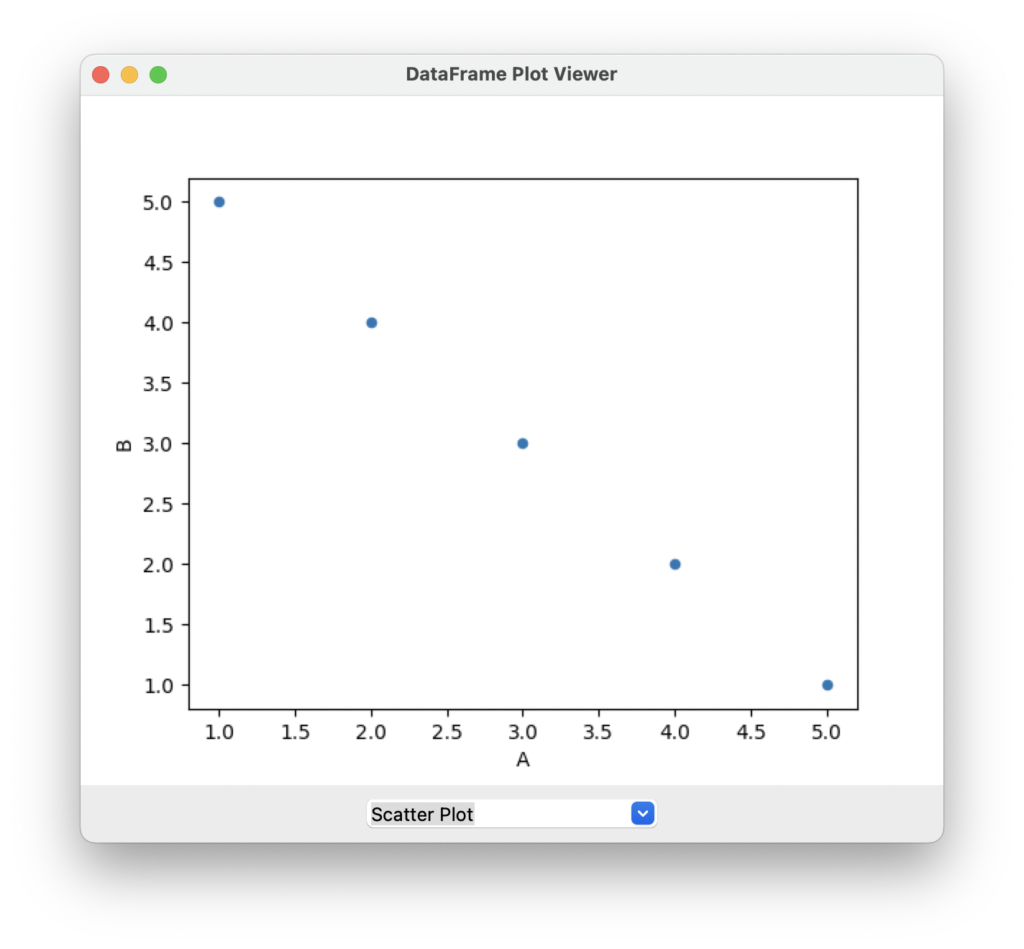
elif plot_selection == "Scatter Plot":
df.plot(kind='scatter', x='A', y='B', ax=ax)
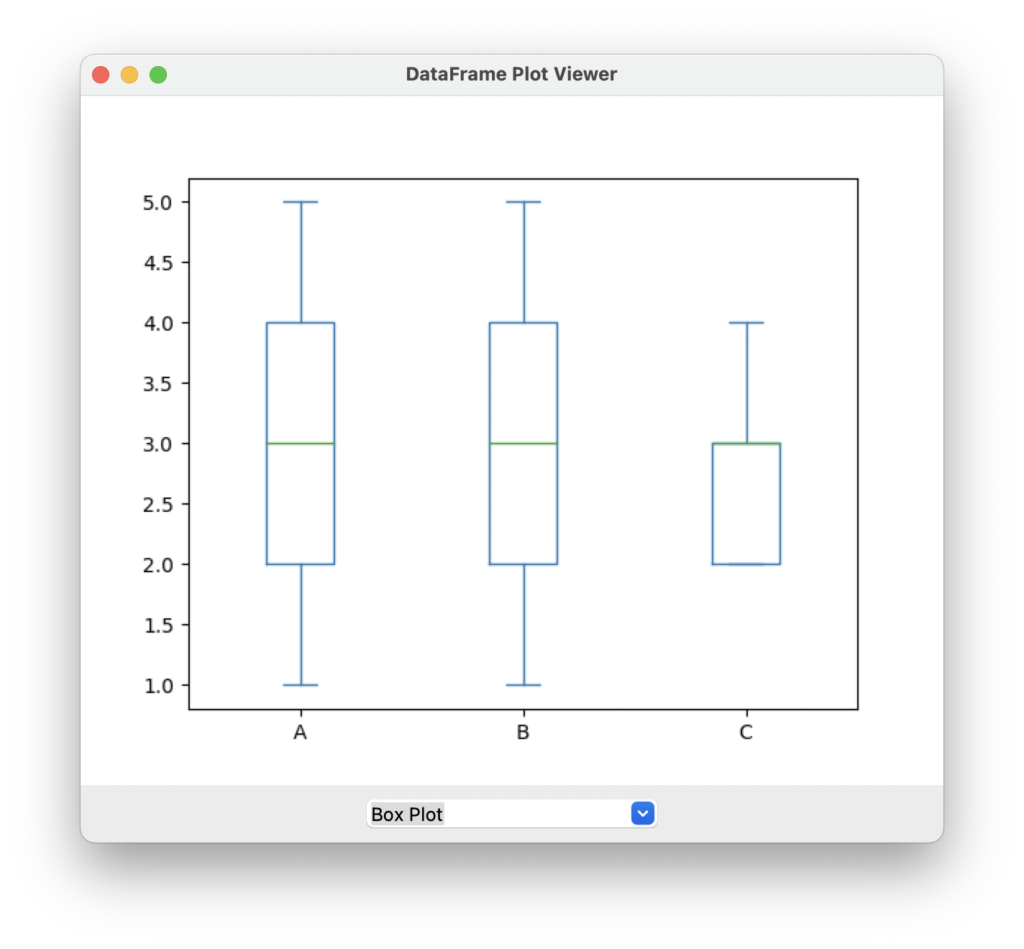
elif plot_selection == "Box Plot":
df.plot(kind='box', ax=ax)
# 기존 캔버스를 제거하고 새 플롯 캔버스 생성
for widget in frame.winfo_children():
widget.destroy()
canvas = FigureCanvasTkAgg(fig, master=frame)
canvas.draw()
canvas.get_tk_widget().pack(fill=tk.BOTH, expand=True)
# 플롯 타입이 선택될 때마다 draw_plot 함수 호출
combobox.bind("<<ComboboxSelected>>", lambda event: draw_plot())
# 초기 플롯 그리기
draw_plot()
root.mainloop()코드 설명
데이터프레임 생성
이 예제에서는 A, B, C라는 세 개의 열을 가진 간단한 데이터프레임을 생성했습니다.
실제 애플리케이션에서는 파일에서 데이터를 읽어오거나, API에서 데이터를 가져오는 등의 방식으로 데이터프레임을 구성할 수 있습니다.
data = {
    'A': [1, 2, 3, 4, 5],
    'B': [5, 4, 3, 2, 1],
    'C': [2, 3, 4, 3, 2]
}
df = pd.DataFrame(data)
Tkinter 와 Matplotlib 백엔드 설정
Mac 환경에서 Tkinter와 Matplotlib를 함께 사용할 때 발생하는 문제를 방지하기 위해 Matplotlib의 백엔드를 ‘TkAgg’로 명시적으로 설정합니다.
이는 플롯이 GUI에 올바르게 표시되도록 돕습니다.
plt.switch_backend('TkAgg')Tkinter 기본 설정 및 GUI 구성
Tkinter의 기본 창을 설정하고, 플롯이 표시될 캔버스를 위한 프레임을 생성합니다.
또한, 사용자가 플롯 유형을 선택할 수 있도록 Combobox를 구성합니다.
root = tk.Tk()
root.title("DataFrame Plot Viewer")
root.geometry("600x400")

frame = tk.Frame(root)
frame.pack(fill=tk.BOTH, expand=True)

plot_type = tk.StringVar()
combobox = ttk.Combobox(root, textvariable=plot_type)
combobox['values'] = ("Line Plot", "Bar Plot", "Scatter Plot", "Box Plot")
combobox.set("Line Plot")
combobox.pack(pady=10)
플롯 그리기 함수
draw_plot 함수는 사용자가 선택한 플롯 유형에 따라 적절한 플롯을 그립니다.
기존에 그려진 플롯이 있다면 이를 클리어하고, 새로운 플롯을 그리기 위해 ax.clear()를 사용합니다.
그런 다음, 새로운 플롯을 GUI에 표시합니다.
def draw_plot():
    fig, ax = plt.subplots()
    plot_selection = plot_type.get()

    ax.clear()

    if plot_selection == "Line Plot":
        df.plot(ax=ax)
    elif plot_selection == "Bar Plot":
        df.plot(kind='bar', ax=ax)
    elif plot_selection == "Scatter Plot":
        df.plot(kind='scatter', x='A', y='B', ax=ax)
    elif plot_selection == "Box Plot":
        df.plot(kind='box', ax=ax)

    for widget in frame.winfo_children():
        widget.destroy()

    canvas = FigureCanvasTkAgg(fig, master=frame)
    canvas.draw()
    canvas.get_tk_widget().pack(fill=tk.BOTH, expand=True)
이벤트 바인딩 및 초기 플롯 그리기
Combobox에서 항목이 선택될 때마다 draw_plot 함수가 호출되도록 이벤트를 바인딩합니다.
또한, 초기 플롯을 그려줍니다.
combobox.bind("<<ComboboxSelected>>", lambda event: draw_plot())

draw_plot()
root.mainloop()
결론
Mac 환경에서도 Tkinter를 사용한 데이터 시각화 GUI 애플리케이션이 원활하게 동작합니다.
사용자는 다양한 플롯 유형을 선택할 수 있으며, 각 플롯은 정확하게 Tkinter GUI에 표시됩니다.
이 코드는 데이터를 시각화하는 애플리케이션을 구축하는 데 강력한 출발점이 될 수 있습니다.
이러한 방법을 활용하면 데이터 분석 및 시각화 도구를 직관적인 인터페이스로 제공할 수 있으며, Mac과 Windows 환경 모두에서 안정적으로 사용할 수 있습니다.
이 코드를 기반으로 자신만의 기능을 추가하여 더욱 발전된 애플리케이션을 만들어보세요!
![[Python] 31. Tkinter GUI 만들기](https://coldbrown.co.kr/wp-content/uploads/2024/08/Python-31.-Tkinter-GUI-만들기-150x150.png)
![[Python] 06. Pandas 데이터프레임 시각화하기 (Matplotlib)](https://coldbrown.co.kr/wp-content/uploads/2023/07/Python-06.-Pandas-데이터프레임-시각화하기-Matplotlib-150x150.png)
![[Python] 15. Scatter plot 그릴 때 circle spec line을 추가하는 방법](https://coldbrown.co.kr/wp-content/uploads/2023/07/Python-15.-Scatter-plot-그릴-때-circle-spec-line을-추가하는-방법-150x150.png)
![[Python] 30. Pandas 데이터프레임 lambda 함수 사용하기](https://coldbrown.co.kr/wp-content/uploads/2023/09/Python-30.-Pandas-데이터프레임-lambda-함수-사용하기-150x150.png)